P-wave tomography for 3-D radial and azimuthal anisotropy of Tohoku and Kyushu subduction zonesVice Professor WANG Jian and his team determined high-resolution P-wave tomography for 3-D radial and azimuthal anisotropy of the Tohoku and Kyushu subduction zones using a large number of high-quality arrival-time data of local earthquakes recorded by the dense seismic network on the Japan Islands. Trench-normal P-wave fast-velocity directions (FVDs) are revealed in the backarc mantle wedge in both Tohoku and Kyushu, which are consistent with the model of slab-driven corner flow. Trench-parallel FVDs with amplitude <4 per cent appear in the forearc mantle wedge under Tohoku and Kyushu, suggesting the existence of B-type olivine fabric there. Trench-parallel FVDs are also visible in the mantle wedge under the volcanic front in Tohoku but not in Kyushu, suggesting that 3-D flow may exist in the mantle wedge under Tohoku and the 3-D flow is affected by the subduction rate of the oceanic plate. Negative radial anisotropy (i.e. vertical velocity being faster than horizontal velocity) is revealed in the low-velocity zones in the mantle wedge under the arc volcanoes in Tohoku and Kyushu as well as in the low-velocity zones below the Philippine Sea slab under Kyushu, which may reflect hot upwelling flows and transitions of olivine fabrics with the presence of water in the upper mantle. Trench-parallel FVDs and positive radial anisotropy (i.e. horizontal velocity being faster than vertical velocity) are revealed in the subducting Pacific slab under Tohoku and the Philippine Sea slab under Kyushu, suggesting that the slabs keep their frozen-in anisotropy formed at the mid-ocean ridge or that the slab anisotropy is induced by the lattice-preferred orientation of the B-type olivine.
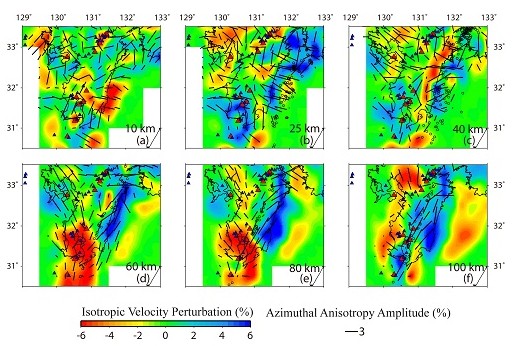
Figure 1. Map views of P-wave azimuthal anisotropy tomography at six depths under Tohoku. (Image by WANG)
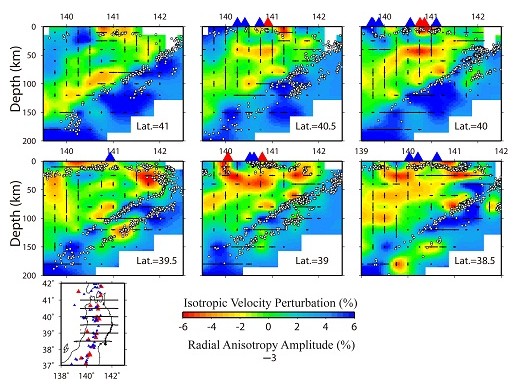
Figure 2. Vertical cross-sections of P-wave radial anisotropy tomography under Tohoku along the profiles as shown on the inset map. (Image by WANG)
Figure 3. Map views of P-wave azimuthal anisotropy tomography in Kyushu. (Image by WANG)
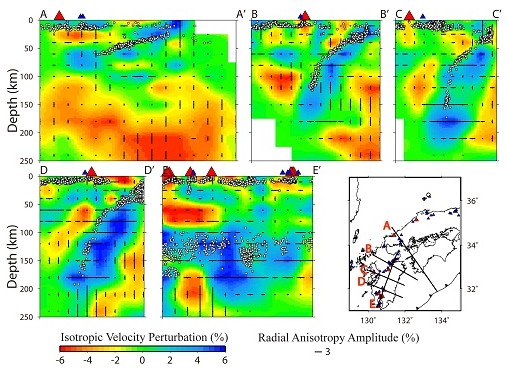
Figure 4. Vertical cross-sections of P-wave radial anisotropy tomography under Kyushu. (Image by WANG) Wang and Zhao. P-wave tomography for 3-D radial and azimuthal anisotropy of Tohoku and Kyushu subduction zones. Geophysical Journal International, 2013, 193: 1166-1181 (Download Here)
|
Contact
Related Articles
Reference
|
 Print
Print Close
Close
-
SIMSSecondary Ion Mass Spectrometer Laboratory
-
MC-ICPMSMultiple-collector ICPMS Laboratory
-
EM & TEMElectron Microprobe and Transmission Electron Microscope Laboratory
-
SISolid Isotope Laboratory
-
StIStable Isotope Laboratory
-
RMPARock-Mineral Preparation and Analysis
-
AAH40Ar/39Ar & (U-Th)/He Laboratory
-
EMLElectron Microscopy Laboratory
-
USCLUranium Series Chronology Laboratory
-
SASeismic Array Laboratory
-
SEELaboratory of Space Environment Exploration Laboratory
-
PGPaleomagnetism and Geochronology Laboratory
-
BioMNSFrance-China Bio-mineralization and Nano-structure Laboratory