An efficient and adaptive approach for modeling gravity effects in spherical coordinatesUpdate time:07 06, 2011
Postdoctor LI Zhiwei and his teacher HAO Tianyao develop an efficient and adaptive approach for modeling gravity effects in spherical coordinates based on the longitudinal/latitudinal grid spacing. The complete gravity effects of spherical prisms, including gravitational potential, gravity vector and tensor gradients, are calculated by numerical integration of the Gauss–Legendre quadrature (GLQ). To ensure the efficiency of the gravity modeling, spherical prisms are recursively subdivided into smaller units according to their distances to the observation point. This approach is compatible with the parameterization of regional arrival time tomography for large areas, in which both the near- and far-field effects of the Earth's curvature cannot be ignored. Therefore, this approach can be implemented into the joint tomographic inversion of arrival time and gravity data conveniently. As practical applications, the complete gravity effects of a single anomalous density body have been calculated, and the gravity anomalies of two tomographic models in the Taiwan region have also been obtained using empirical relationships between P-wave velocity and density. Li et al. An efficient and adaptive approach for modeling gravity effects in spherical coordinates. Journal of Applied Geophysics, 2011, 73: 221-231 (Download Here)
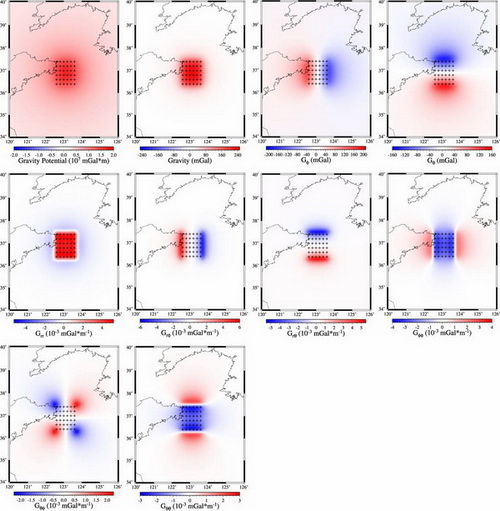
Fig. Gravity effects (i.e. potential, vector and tensor gradient fields) of a single density anomalous body located at 5–32.5 km depth. Grid locations with density anomalies are indicated by small crosses. (Image by LI)
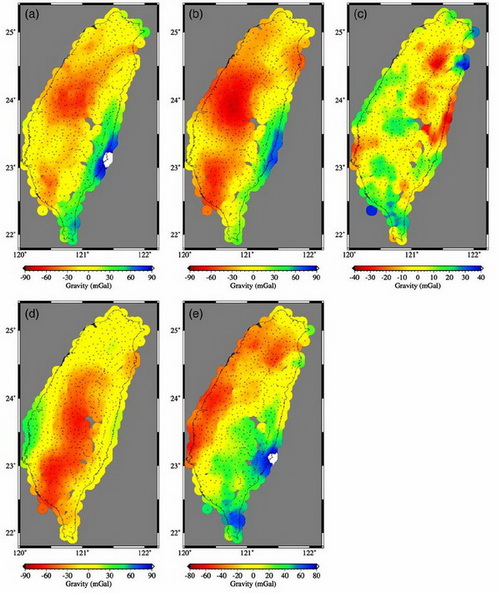
Fig. (a) Bouguer gravity in the Taiwan region. (b) Calculated gravity anomalies from a 3-D velocity model from the joint inversion of arrival time and gravity data. (c) Residuals between Bouguer and calculated gravity shown in figure b. (d) Calculated gravity from 3-D velocity models from inversion of arrival time data only. (e) Residuals between Bouguer and calculated gravity shown in figure d. Small crosses indicate the gravity observation locations. (Image by LI)
|
Contact
Related Articles
Reference
|
-
SIMSSecondary Ion Mass Spectrometer Laboratory
-
MC-ICPMSMultiple-collector ICPMS Laboratory
-
EM & TEMElectron Microprobe and Transmission Electron Microscope Laboratory
-
SISolid Isotope Laboratory
-
StIStable Isotope Laboratory
-
RMPARock-Mineral Preparation and Analysis
-
AAH40Ar/39Ar & (U-Th)/He Laboratory
-
EMLElectron Microscopy Laboratory
-
USCLUranium Series Chronology Laboratory
-
SASeismic Array Laboratory
-
SEELaboratory of Space Environment Exploration Laboratory
-
PGPaleomagnetism and Geochronology Laboratory
-
BioMNSFrance-China Bio-mineralization and Nano-structure Laboratory

 Print
Print Close
Close

