After Mar. 11, 2011, Mw 8.9 Earthquake, WANG Weimin, HAO Jinlai and YAO Zhenxing research the Focal mechanism and the rupture process using the seismic data from Incorporated Research Institutions for Seismologe (IRIS). Several preliminary results are given.(Download data here)

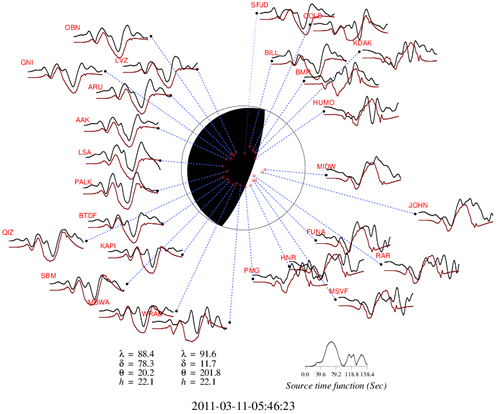
Figure 1 Focal mechanism of the Mw8.9 Near the Coast of Honshu, Japan earthquake. ( Image by WANG Weimin et al)
Lower-hemisphere projection is used here. The observed P wave records (black line) and the synthetic seismogram (red line) based on the simple point model are compared. The parameters of two possible fault planes are listed also, with l, d, q ,h indicating the rake angle, dip angle, strike direction and source depth respectively. The obtained source time function are plotted

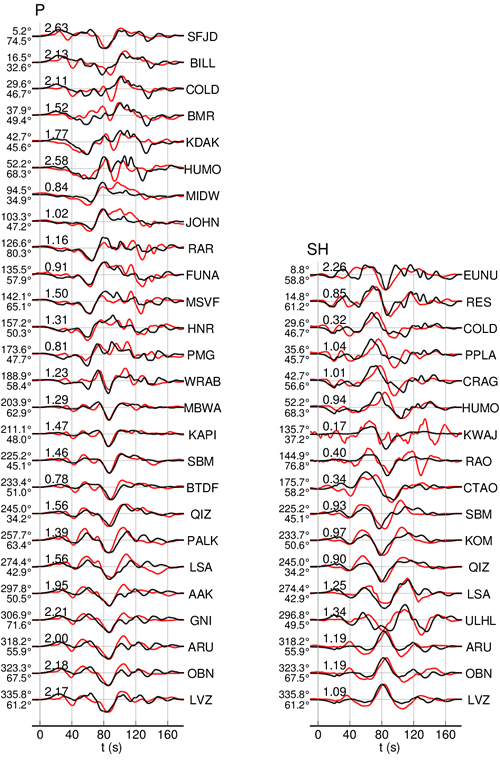
Figure 2 Comparison of the observed teleseismic P and SH records with the synthetic waveforms.( Image by WANG Weimin et al)
Comparison of observed (black) and synthetic waveforms (red) for P vertical components, and SH components are shown in the panel, the azimuth, epicentral distance, amplitude ratio and station name are also indicated.

Figure 2 Inverted slip distribution on the fault. ( Image by WANG Weimin et al)
Surface projection of fault model ( up-left ) and 3D view of the fault model ( up-right ) are shown

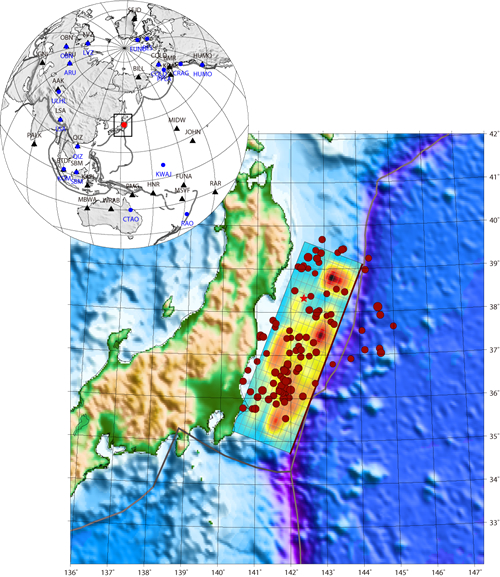
Fig. 4 The map shows the projection of slip distribution on the ground ( Image by WANG Weimin et al)
The location of the stations which records are used in source inverse (upper panel): the black triangles and blue circles represent the stations used for P wave and SH wave inversion respectively. The dark red dots indicate aftershocks from USGS after mainshock 8 hours.